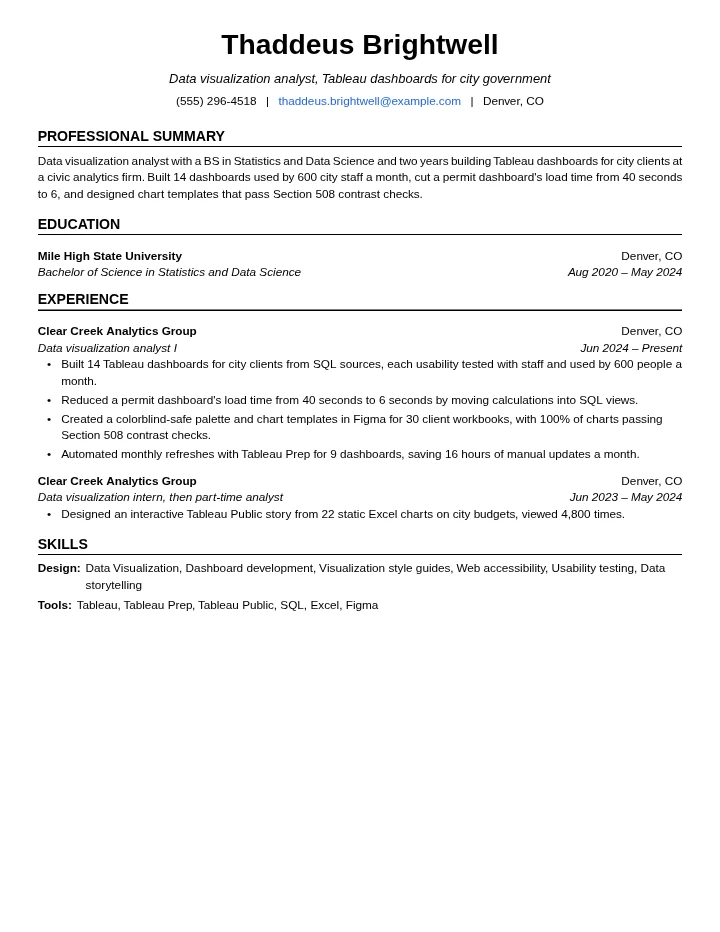
Thaddeus Brightwell
Data visualization analyst, Tableau dashboards for city government
Denver, COthaddeus.brightwell@example.com(555) 296-4518
Summary
Data visualization analyst with a BS in Statistics and Data Science and two years building Tableau dashboards for city clients at a civic analytics firm. Built 14 dashboards used by 600 city staff a month, cut a permit dashboard's load time from 40 seconds to 6, and designed chart templates that pass Section 508 contrast checks.
Experience
Data visualization analyst I
Jun 2024 – Present
Clear Creek Analytics Group · Denver, CO
- Built 14 Tableau dashboards for city clients from SQL sources, each usability tested with staff and used by 600 people a month.
- Reduced a permit dashboard's load time from 40 seconds to 6 seconds by moving calculations into SQL views.
- Created a colorblind-safe palette and chart templates in Figma for 30 client workbooks, with 100% of charts passing Section 508 contrast checks.
- Automated monthly refreshes with Tableau Prep for 9 dashboards, saving 16 hours of manual updates a month.
Data visualization intern, then part-time analyst
Jun 2023 – May 2024
Clear Creek Analytics Group · Denver, CO
- Designed an interactive Tableau Public story from 22 static Excel charts on city budgets, viewed 4,800 times.
Education
Bachelor of Science in Statistics and Data Science
Aug 2020 – May 2024
Mile High State University · Denver, CO
Skills
- Design
- Data Visualization, Dashboard development, Visualization style guides, Web accessibility, Usability testing, Data storytelling
- Tools
- Tableau, Tableau Prep, Tableau Public, SQL, Excel, Figma