Data analyst resume examples & writing guide for 2026

Three data analyst resumes at entry, mid and senior level, rendered in a real template and annotated line by line. Each one pairs the stack with a number a hiring manager can verify: forecast error, hours saved, dollars found, and who opens the dashboards.

By the Resumi editorial teamUpdated 11 min read

Showing the mid-level example

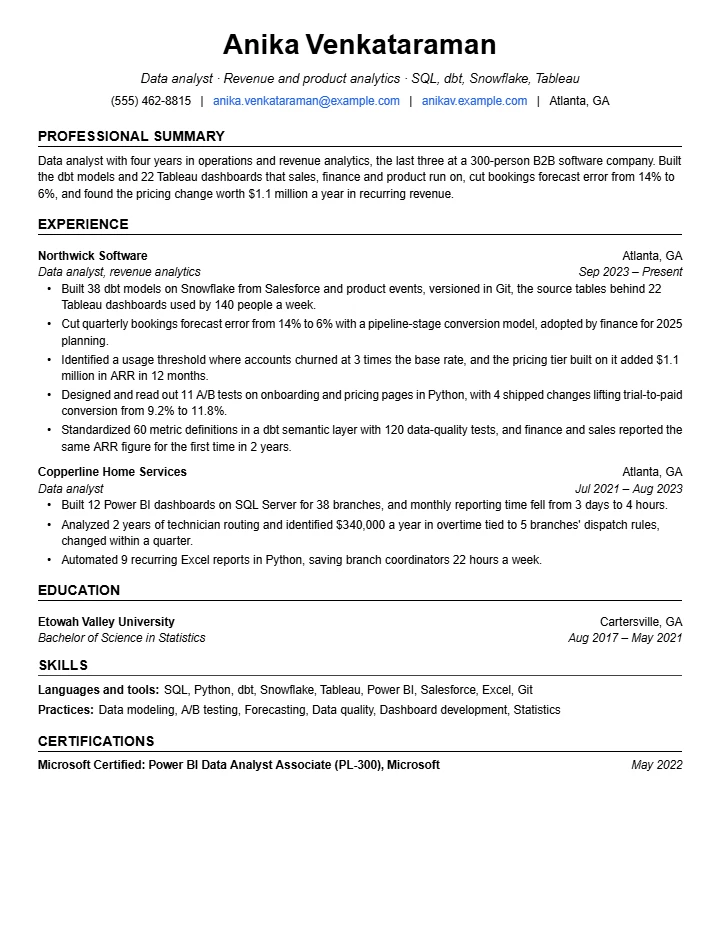
Data analyst resume example, mid level, rendered in The Jake's template
Strength: Excellent

Written by the Resumi editorial team for a fictional candidate. Role facts come from O*NET and the U.S. Bureau of Labor Statistics.

Strength band is Resumi’s optimization score, not a ranking any employer sees.

What makes this resume work

Each marker on the page has a note here. Press a marker to jump to its note.

  1. 1

    Stack and scope in the headline

    Revenue and product analytics, then SQL, dbt, Snowflake and Tableau. Mid-level postings name a domain and a modern warehouse stack, and a headline that carries both matches the search a recruiter runs before reading.

  2. 2

    Models counted with their consumers

    Thirty-eight dbt models feeding 22 dashboards used by 140 people a week. The number that matters is not the models but the people who rely on them. Written this way, the modeling work is infrastructure, not a side project.

  3. 3

    Forecast error with a baseline

    From 14% to 6%, with the method and the team that adopted it. Finance adopting the model is the outcome. A number with both ends and an owner survives the first interview question about where it came from.

  4. 4

    Experiments carried to shipped changes

    Eleven tests, four shipped, and conversion from 9.2% to 11.8%. Test counts alone say little. Naming how many changed the product and by how much shows the analysis reached a decision, which postings ask for by name.

  5. 5

    Earlier role kept to its numbers

    The operations years keep three lines: dashboards with the time saved, an overtime finding in dollars and an automation in hours a week. Four years fit one page and the move from operations to revenue analytics stays visible.

  6. 6

    Practices and tools split

    Languages and tools on one line, practices on the next: data modeling, A/B testing, forecasting, data quality. A screener matching a posting finds each term, and every one is backed by a bullet above.

Build your data analyst resume

Free to start · no card

01The example, in full

The resume shown above, as text you can search and copy.

Anika Venkataraman

Data analyst · Revenue and product analytics · SQL, dbt, Snowflake, Tableau

Atlanta, GAanika.venkataraman@example.com(555) 462-8815anikav.example.com

Summary

Data analyst with four years in operations and revenue analytics, the last three at a 300-person B2B software company. Built the dbt models and 22 Tableau dashboards that sales, finance and product run on, cut bookings forecast error from 14% to 6%, and found the pricing change worth $1.1 million a year in recurring revenue.

Experience

Data analyst, revenue analytics

Sep 2023 – Present

Northwick Software · Atlanta, GA

  • Built 38 dbt models on Snowflake from Salesforce and product events, versioned in Git, the source tables behind 22 Tableau dashboards used by 140 people a week.
  • Cut quarterly bookings forecast error from 14% to 6% with a pipeline-stage conversion model, adopted by finance for 2025 planning.
  • Identified a usage threshold where accounts churned at 3 times the base rate, and the pricing tier built on it added $1.1 million in ARR in 12 months.
  • Designed and read out 11 A/B tests on onboarding and pricing pages in Python, with 4 shipped changes lifting trial-to-paid conversion from 9.2% to 11.8%.
  • Standardized 60 metric definitions in a dbt semantic layer with 120 data-quality tests, and finance and sales reported the same ARR figure for the first time in 2 years.

Data analyst

Jul 2021 – Aug 2023

Copperline Home Services · Atlanta, GA

  • Built 12 Power BI dashboards on SQL Server for 38 branches, and monthly reporting time fell from 3 days to 4 hours.
  • Analyzed 2 years of technician routing and identified $340,000 a year in overtime tied to 5 branches' dispatch rules, changed within a quarter.
  • Automated 9 recurring Excel reports in Python, saving branch coordinators 22 hours a week.

Education

Bachelor of Science in Statistics

Aug 2017 – May 2021

Etowah Valley University · Cartersville, GA

Skills

Languages and tools
SQL, Python, dbt, Snowflake, Tableau, Power BI, Salesforce, Excel, Git
Practices
Data modeling, A/B testing, Forecasting, Data quality, Dashboard development, Statistics

Certifications

Microsoft Certified: Power BI Data Analyst Associate (PL-300)

May 2022

Microsoft

02Market snapshot

Median pay
$120,230 median annual pay for data scientists, the occupation that includes data analysts
Typical education
Bachelor's degree in mathematics, statistics, computer science or a related field. Some employers prefer a master's
Job outlook
+35% employment growth for data scientists, 2025–35, much faster than average. About 24,800 openings a year
Common credentials
No license. Power BI Data Analyst Associate, CAP and Google's Professional Data Engineer are optional; 18 listed for the code

Sources: BLS OES (May 2025) · BLS OOH (2025) · CareerOneStop (2026)

03The same resume at three levels

The tinted row is the level shown above.

  • Entry-level

    0–2 years

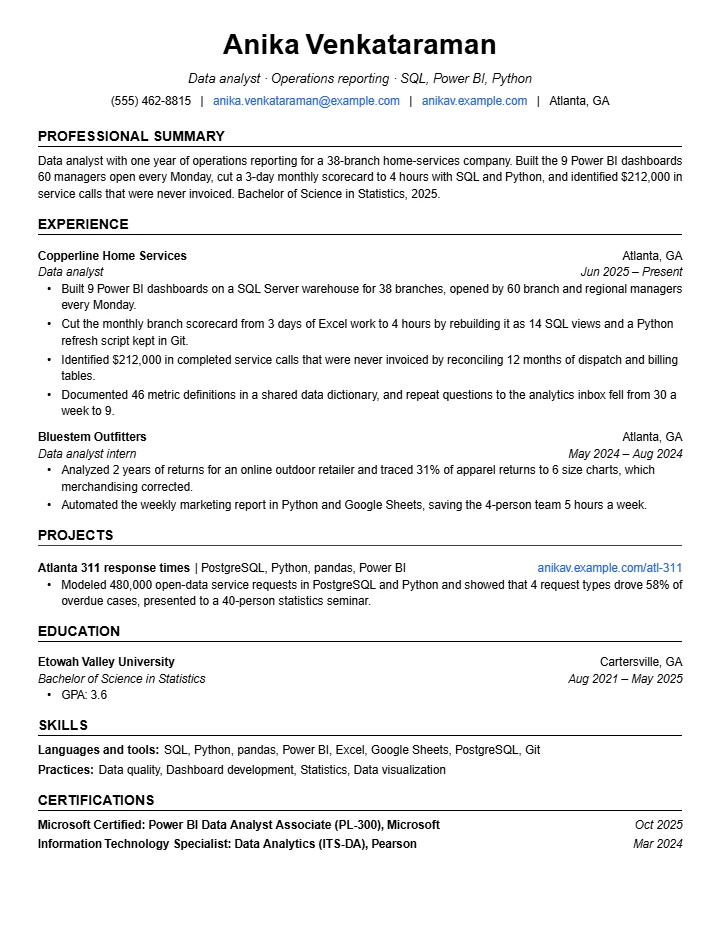
    Experience leads even after one year, because the reporting produced dashboards with an audience, hours saved and dollars found. The headline names the stack. The internship reads as findings, the single project ends in a decision, and the certification sits dated under the skills line where a screener expects it.

    Typical titles: Data analyst, Junior data analyst, Reporting analyst

  • Mid-level

    3–6 years

    The default view. Revenue analytics at a software company, with the warehouse models, the forecast and the experiments each carrying a baseline and the team that used the result. The operations years keep three numbered lines, and the skills section splits tools from practices so every term matches a bullet above.

    Typical titles: Data analyst, Business intelligence analyst, Analytics engineer

  • Senior

    7+ years

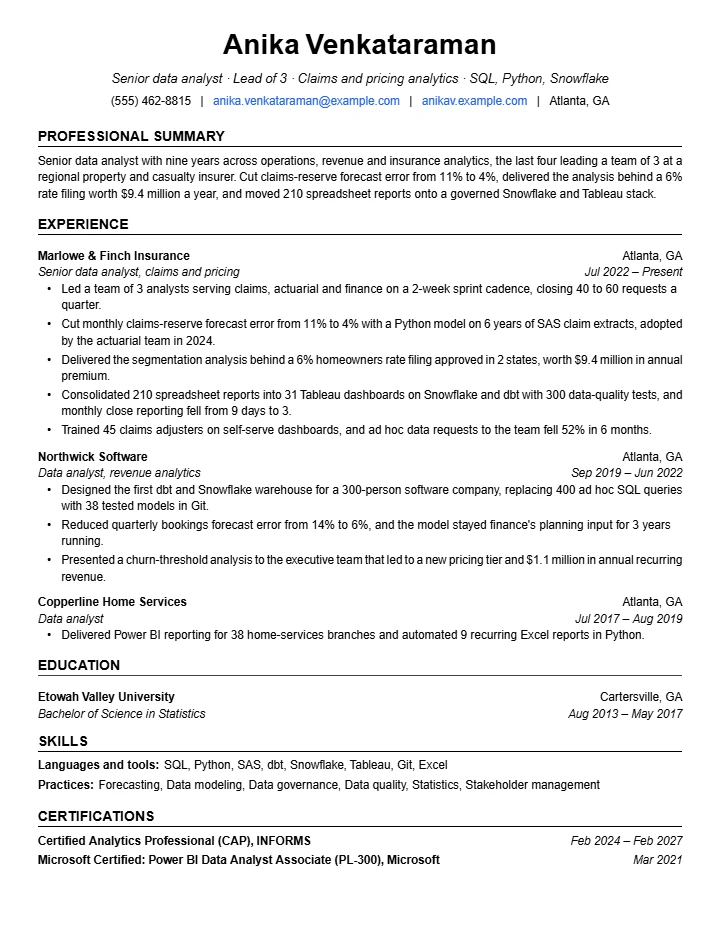
    Scope replaces tasks: a team of 3, a domain, a rate filing in dollars and a platform migration in reports and days. The software years keep three lines with their numbers, the first job keeps one, and the CAP and a dated Power BI certificate close the page after the results.

    Typical titles: Senior data analyst, Lead data analyst, Analytics manager

04Summary

Weak

Detail-oriented data analyst passionate about turning data into actionable insights, with strong SQL and visualization skills and a proven ability to work cross-functionally.

Strong

Data analyst with four years in operations and revenue analytics, the last three at a 300-person software company. Built the dbt models and 22 Tableau dashboards that sales, finance and product run on, cut bookings forecast error from 14% to 6%, and found the pricing change worth $1.1 million a year.

The setting, the stack in use, who consumes the work and two results with baselines a finance lead can check. The weak version could open any analyst's resume and gives a screener nothing to search for or verify.

05Bullets

Weak

  • Responsible for creating dashboards and reports in Tableau to provide insights to stakeholders across the business.

Strong

  • Cut quarterly bookings forecast error from 14% to 6% with a pipeline-stage conversion model, adopted by finance for 2025 planning.

An error rate with a baseline, the method in five words and the team that adopted the output. An interviewer can ask how the model handled skipped stages, and the candidate can answer. The weak bullet is the posting itself, counts dashboards instead of decisions, and a hiring manager who has read a hundred of them stops only on the number.

06Skills and keywords

Languages and tools

  • SQL (in the example)
  • Python (in the example)
  • dbt (in the example)
  • Snowflake (in the example)
  • Tableau (in the example)
  • Power BI (in the example)
  • Salesforce (in the example)
  • Excel (in the example)
  • Git (in the example)
  • R
  • BigQuery
  • Looker
  • Databricks

Practices

  • Data modeling (in the example)
  • A/B Testing (in the example)
  • Forecasting (in the example)
  • Data quality (in the example)
  • Dashboard development (in the example)
  • Statistics (in the example)
  • Data Visualization
  • ETL
  • Data governance (in the example)
  • Stakeholder Management
  • Cohort analysis

Credentials

  • Microsoft Certified: Power BI Data Analyst Associate (PL-300) (in the example)
  • Certified Analytics Professional (CAP)
  • Associate Certified Analytics Professional (aCAP)
  • Microsoft Azure Data Fundamentals (DP-900)
  • Information Technology Specialist: Data Analytics (ITS-DA)
  • Google Professional Data Engineer

Filled chips appear in the example above.

Paste a job description and Resumi shows which of these your resume already covers.

Build your data analyst resume

07Mistakes to avoid

  1. Record counts written as results

    Fix: Hiring managers call a line like analyzed 1 million records worthless, because volume is not an outcome. Write what the analysis changed: forecast error from 14% to 6%, 22 hours a week saved, $212,000 found. Keep the row count only when scale was the problem you solved.

  2. Dashboards counted without the decision behind them

    Fix: A count of dashboards says you can use the tool. Postings ask for analysis carried through to a decision, and practitioners say most of the job is cleaning and preparing data. Name who opens the dashboard, how often, and one decision it changed.

  3. Every tool in the stack listed, none shown

    Fix: A skills line with Tableau, Power BI, Spark and Hadoop reads as a catalog. Postings name SQL first, then one BI tool, then Python. List the tools you used this year, and put each inside a bullet with its result, so the SQL round holds no surprises.

  4. Coursework and certificates ahead of work experience

    Fix: Hiring managers who screen entry-level analysts say they read for industry experience first, then work experience, then tools. Put the job or the internship above the capstone, and keep certificates to a dated line under skills. A list of courses does not move the resume up.

  5. Two pages, or the finding behind a link

    Fix: One hiring manager says to treat the resume like a dashboard landing page. A federal posting rejects anything over two pages and states that embedded links are not opened. Keep one page through ten years, and write the finding on the page, not behind a portfolio link.

08Format and template

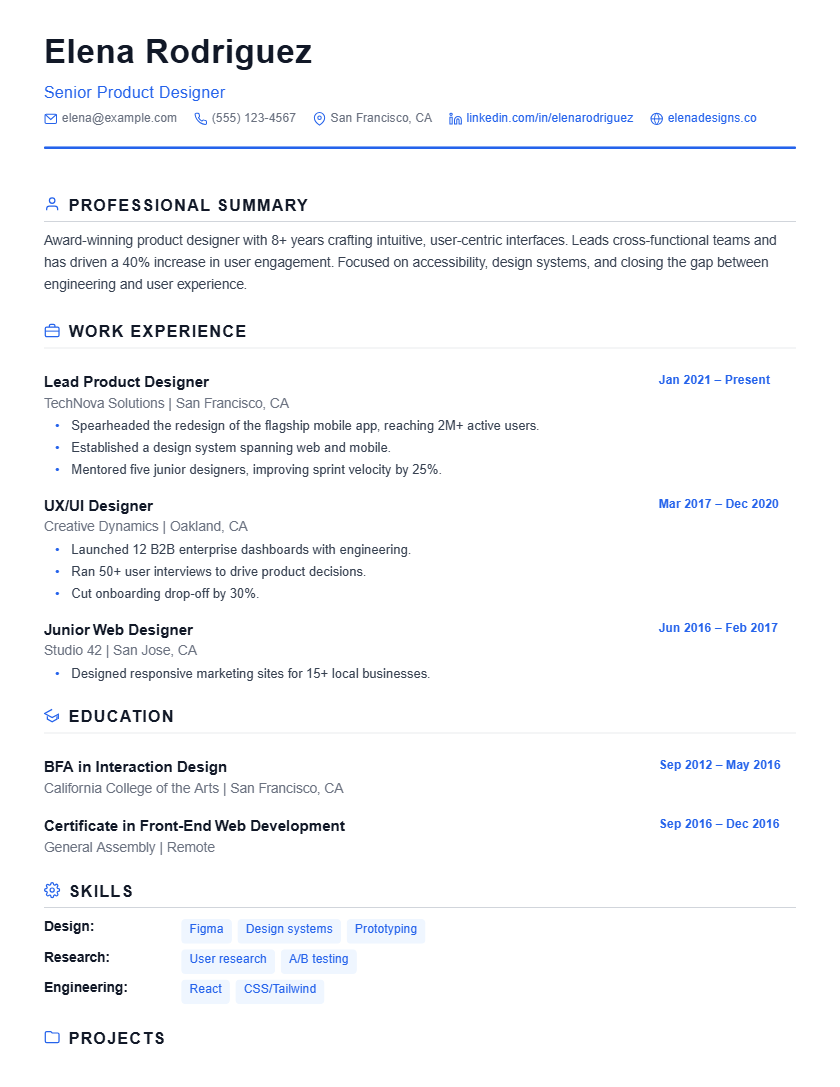
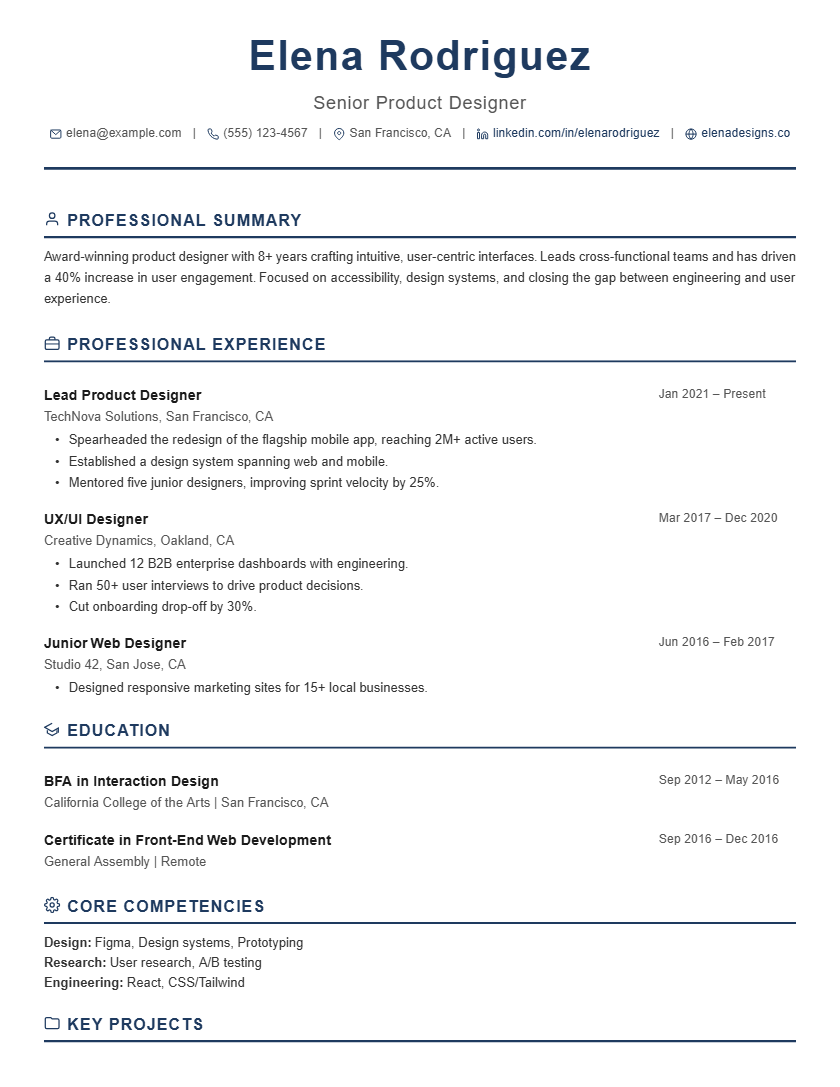
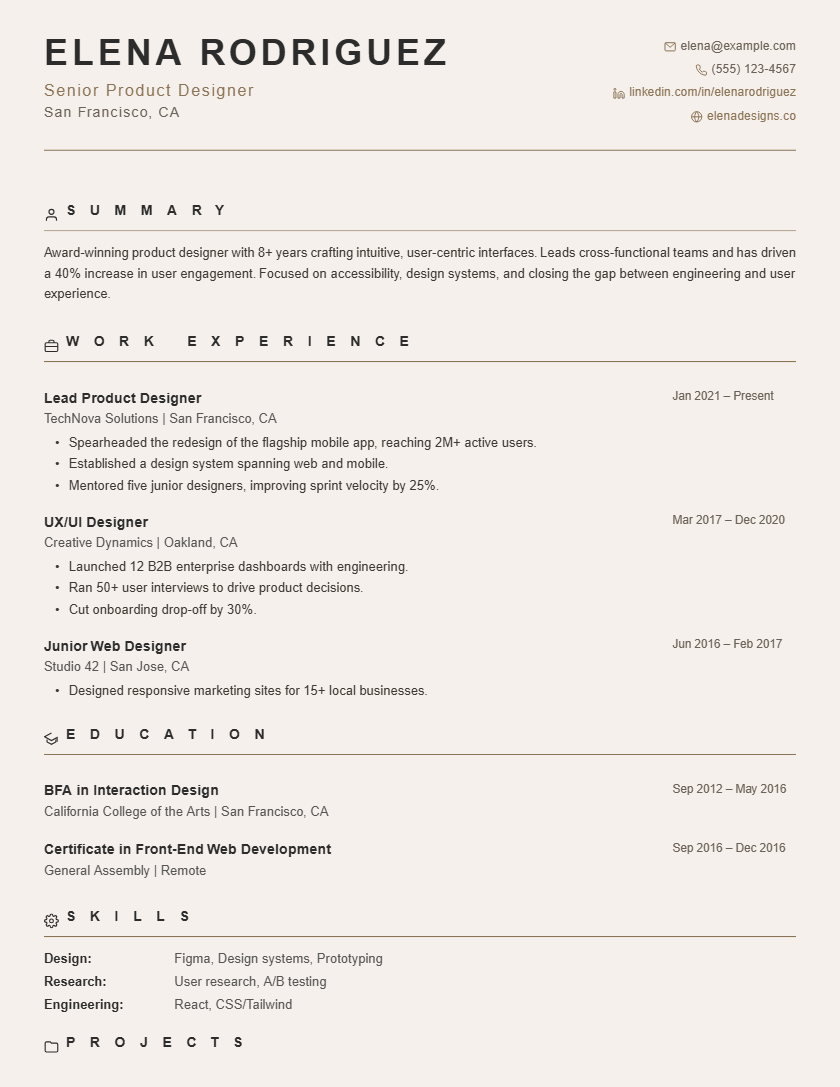
One column, in this order: summary, experience, projects when you have them, education, skills, certifications, which is how The Jake's template lays it out. A hiring manager reads the summary for the setting and the stack, then the first three bullets for baselines, then the skills line to match the posting. Keep the tool names inside the bullets where the results are, and let the skills section repeat them by kind. Standard, Executive Classic and Warm Classic hold the same content in one column. Whichever you pick, the forecast error, the hours saved and the dollars found stay in the first screen.

Shown above: The Jake's

  • Standard template
    StandardFree
  • Executive Classic template
    Executive Classic
  • Warm Classic template
    Warm Classic

09Questions data analysts ask

What numbers should a data analyst put on a resume?

The ones the business already tracks: forecast error before and after, hours a week saved by an automation, dollars found or recovered, a conversion rate moved by a test, the number of people who open a dashboard and how often, failed data-quality checks cut from one count to another. Hiring managers who screen analysts say record counts do not qualify, since a million rows is the input, not the result. Give each number a baseline and a period, and name the system it lives in, because the first interview question is where it came from.

Do I need Python for a data analyst job, or is SQL and Excel enough?

SQL first, always. O*NET's postings data puts Python and SQL at the top of the in-demand list for the occupation, followed by R, Tableau and Power BI, with Excel and Snowflake further down. Hiring managers report senior candidates failing on window functions, so joins, CTEs and window functions matter more than a long language list. Add one BI tool you can defend and Python for the automation and the tests that SQL alone cannot run. Excel still appears in postings, but it is the floor, not the case.

Which data analyst certifications are worth listing?

None is required, and CareerOneStop lists no license for the occupation in any state. Its finder lists 18 certifications for the data scientists code and marks Microsoft's Power BI Data Analyst Associate as in demand on the related business intelligence analyst list. INFORMS's Certified Analytics Professional and its associate level are the vendor-neutral credentials. Practitioners are blunt that a certificate course on its own does not get interviews, so list each with its date under the skills line and let the bullets above make the case.

How do I get a data analyst job with no experience?

Lead with work, even work outside data. Hiring managers who filter entry-level applications say they read for industry experience first, then any work experience, then evidence of soft skills, then tools, and that a master's degree with no experience is not a selling point. An internship, a part-time job with a reporting task, or an operations role where you automated a spreadsheet all count. Then add one or two projects that end in a finding and a decision, the way the entry example's 311 project does, and put the certificate last.

Should a data analyst resume mention AI tools?

Yes, where a tool changed a result you can name. Postings this year ask for hands-on use of AI coding assistants for modeling, scripting and analysis, and the handbook credits the occupation's growth partly to the integration of AI-based systems. A bullet that says an assistant helped rebuild 38 models in a quarter, with the test failures that fell afterward, earns the line. A skills chip that says AI with nothing behind it reads as the awareness claim it is, so write the workflow and the number or leave it out.

Data analyst or data scientist: which title goes on the resume?

The one the posting uses. The Bureau of Labor Statistics and O*NET file data analysts under data scientists, code 15-2051, which is why the pay and outlook figures on this page name data scientists, and business intelligence analysts sit under a separate O*NET code. Employers use the titles differently, so match the posting's title in your headline and let the bullets show the level: reporting and dashboards for analyst roles, models and experiments carried to shipped decisions for the senior and scientist end.

Free to start

Build your data analyst resume

No card, no trial that turns into a charge.

Sign up free